Case Study
ChartGPT
Helping people understand complex charts through conversation.
Independent product — designed and developed by me.
Overview
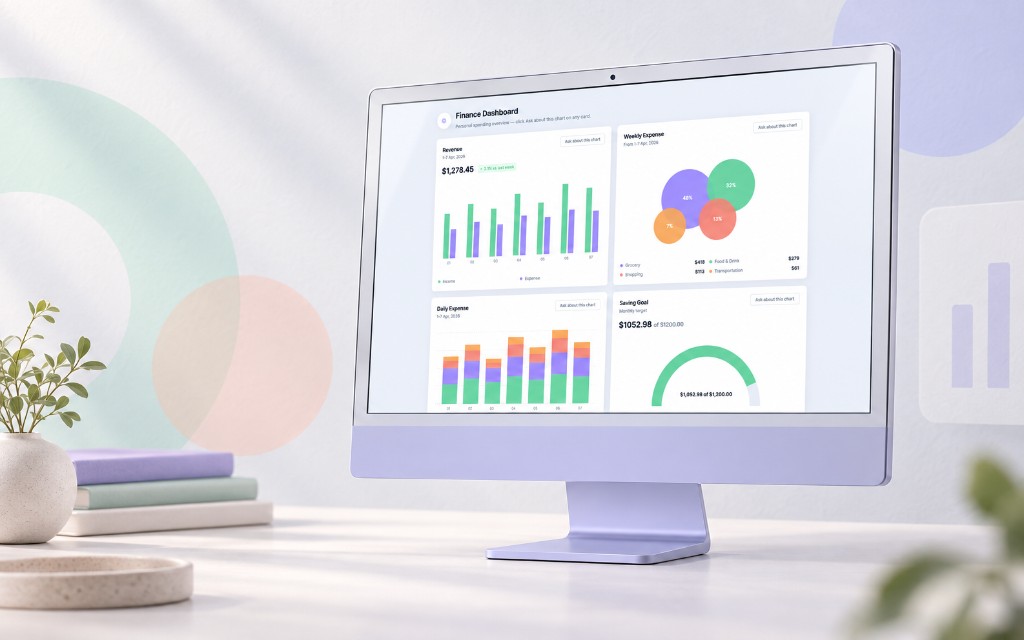
ChartGPT is an independent product designed and developed to help people understand data visualizations through conversation. Rather than expecting users to interpret charts on their own, it provides a focused modal experience where they can ask suggested or custom questions and receive explanations tied to the selected visualization.
The problem
Data visualizations are only useful when people can interpret them correctly. Many users struggle to extract meaning from charts, especially when the data is unfamiliar or the visualization is dense. The challenge was to create a reusable pattern that makes chart exploration more approachable without overwhelming the surrounding interface.
My role
Key decisions
- Used a modal pattern to keep chart context focused while opening a conversational layer.
- Offered suggested questions alongside free-form input to reduce blank-page friction.
- Built the tool as a reusable component that can wrap different chart types.
- Prioritized accessible modal behavior, keyboard navigation, and clear focus management.
- Kept the AI integration scoped to the selected visualization rather than open-ended chat.
Technical approach
The application is built with React and TypeScript, with a component architecture that separates chart rendering, modal interaction, and AI response handling. Suggested prompts and custom questions flow through a structured interface designed to keep responses relevant to the active visualization.
Accessibility considerations
The modal uses semantic dialog patterns with keyboard trap management, visible focus states, and screen-reader-friendly labels. Interactive controls are reachable by keyboard, and the conversational panel maintains logical reading order alongside the chart context.
Outcome
ChartGPT demonstrates a reusable approach to chart assistance: open a visualization in a focused layer, ask questions, and receive contextual explanations. The pattern is designed to integrate into dashboards and data-heavy products without redesigning the entire experience.
What I learned
This project reinforced that AI-assisted interfaces work best when the interaction scope is clear. Constraining conversation to a selected chart made the experience feel more useful and trustworthy than a generic chat interface.