Case Study
Institute Dashboard
Turning complex institutional data into an accessible dashboard.
Independent product — designed and developed by me.
Overview
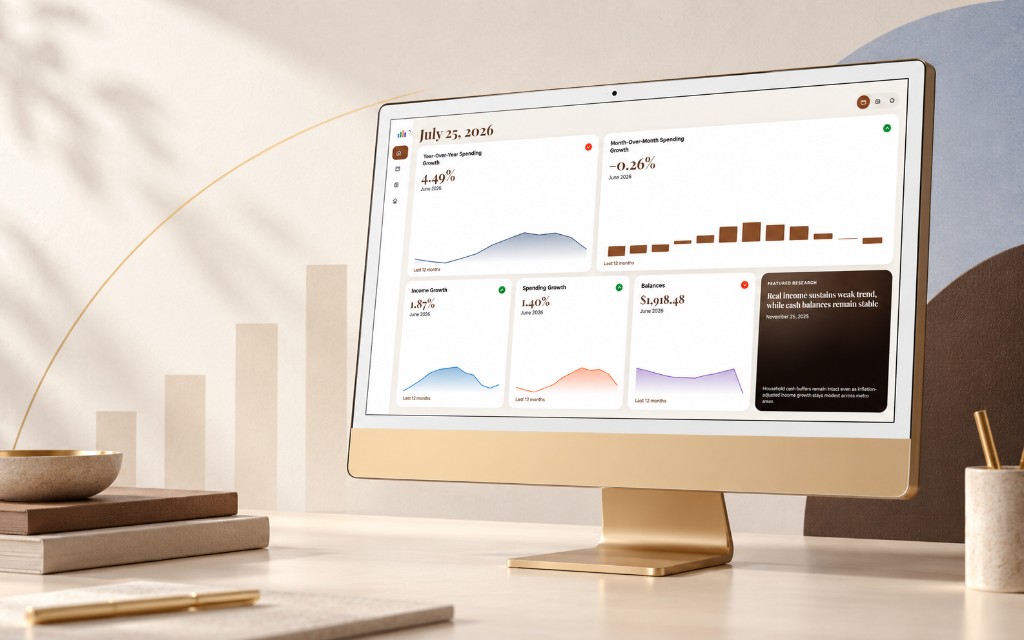
Institute Dashboard is an independent product designed and developed to make institutional data easier to explore. It combines custom React interface controls with D3-powered visualizations, giving users a way to filter, compare, and understand complex datasets through an accessible dashboard experience.
The problem
Institutional datasets often contain many dimensions, filters, and metrics that are difficult to present in a single static view. Users need to explore data interactively without losing context or becoming overwhelmed by technical complexity.
My role
Key decisions
- Separated filter controls from visualization areas to keep the interface scannable.
- Used D3 for data-driven charts while keeping React responsible for UI state and layout.
- Designed KPI summary cards to surface key metrics before users dive into detailed views.
- Structured the dashboard for responsive layouts so controls remain usable on smaller screens.
- Applied accessible color contrast and non-color-dependent cues in visualizations where possible.
Technical approach
The dashboard pairs React components for filters, layout, and interaction state with D3 modules for rendering charts and handling data transformations. Custom controls update shared state that drives both summary metrics and detailed visualizations.
Accessibility considerations
Charts include text alternatives and descriptive labels where applicable. Filter controls use semantic form elements with visible labels and focus states. The layout maintains logical heading order and keyboard access to interactive elements.
Outcome
The dashboard turns a complex institutional dataset into an explorable interface where users can filter, compare, and interpret data through a cohesive set of controls and visualizations.
What I learned
Combining React and D3 requires clear boundaries: React owns the component tree and interaction model, while D3 handles the data-to-visual mapping. Defining that split early prevented unnecessary coupling between UI state and chart rendering.